Alignment
align(seq, opts) resamples a TimeSeries onto a
Sequence grid, producing
one Interval-keyed event per grid point. The value at each grid
point is computed by sampling the source — either holding the most
recent source value or interpolating between the two nearest.
This is the right operator when the question is "what was the value at this grid point?" — chart sampling, fixed-cadence exports, regularising irregular telemetry. For "what's the rollup of every event inside this bucket?", reach for Aggregation instead.
Mental model
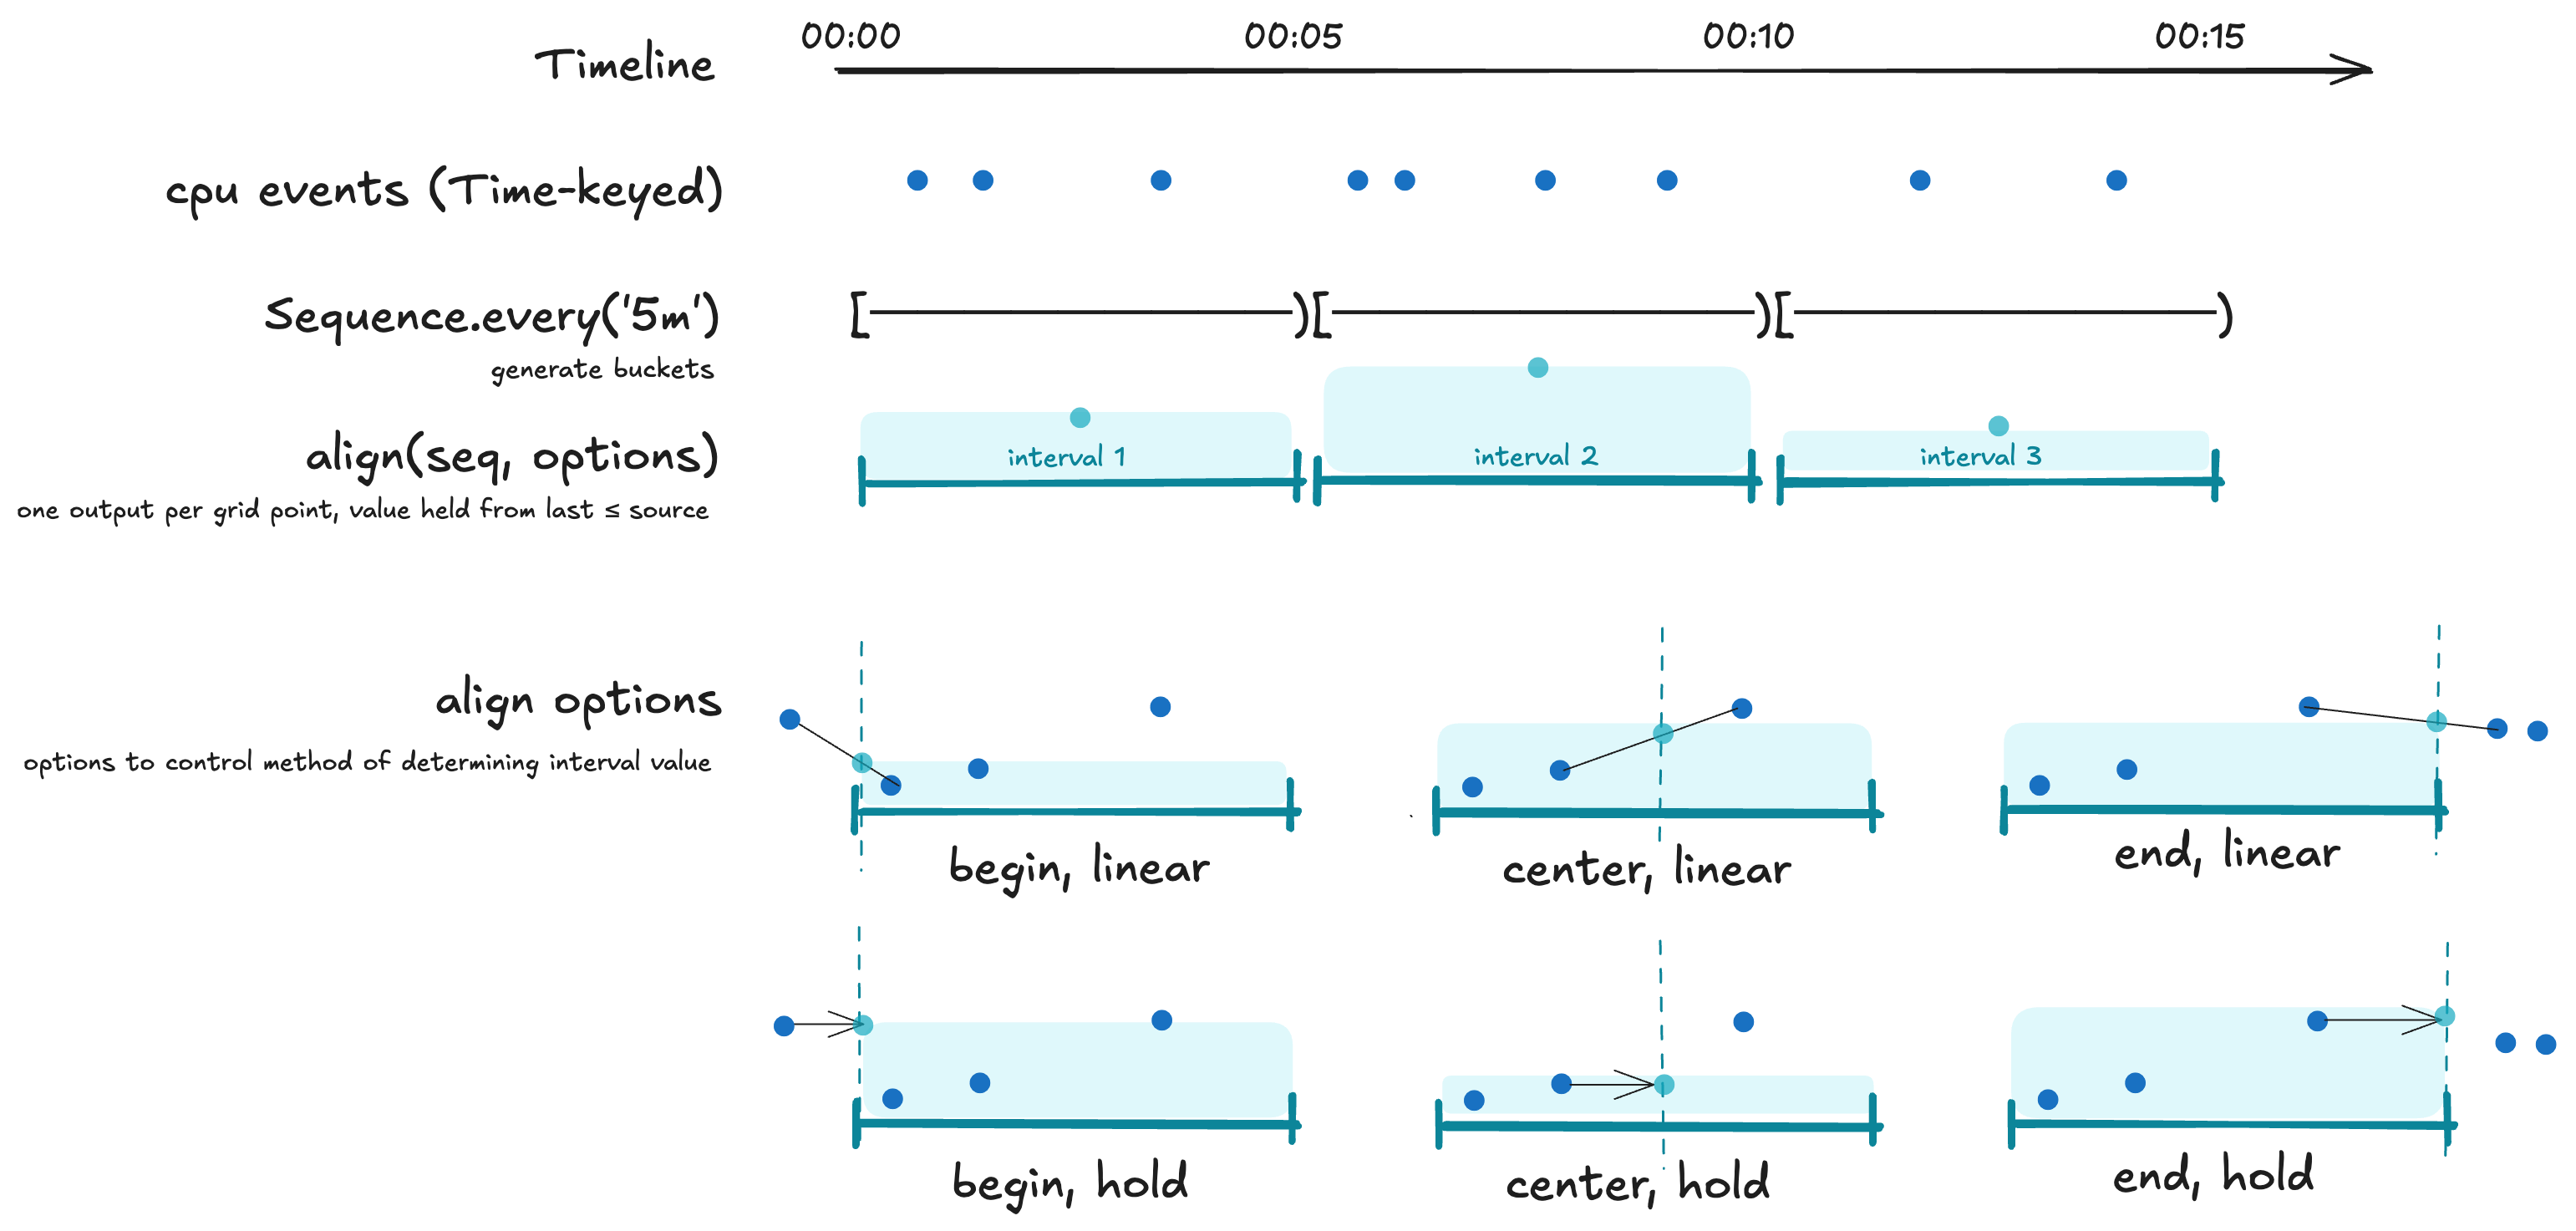
For each grid point, align picks a single source value through
two settings: sample (where inside the grid step to read) and
method (how to derive the value at that point).
import { Sequence, TimeSeries } from 'pond-ts';

const cpu = TimeSeries.fromJSON({
  name: 'cpu',
  schema: [
    { name: 'time', kind: 'time' },
    { name: 'cpu', kind: 'number' },
  ] as const,
  rows: [
    ['2025-01-01T00:00:00Z', 0.31],
    ['2025-01-01T00:00:30Z', 0.44],
    ['2025-01-01T00:01:30Z', 0.48],
  ],
});

const aligned = cpu.align(Sequence.every('1m'), {
  method: 'hold',
  sample: 'begin',
});
// one row per minute on the source's range, value held from
// the most recent source ≤ the grid point.
Parameters
| Option | Type | Default | Effect |
|---|---|---|---|
method | 'hold' | 'linear' | 'hold' | How to derive the value at the sample point |
sample | 'begin' | 'center' | 'end' | 'begin' | Where inside each grid step to read |
range | TimeRange | source extent | Pin the output range explicitly |
method
'hold'— carry the most recent source value at or before the sample point. Output isundefinedfor grid points before the first source event. Works on any column kind.'linear'— interpolate between the two source values surrounding the sample point. Numeric columns only; throws onTimeRange- orInterval-keyed sources, falls back to'hold'for non-numeric columns.
sample
'begin'— read at the grid step's start (the interval's inclusive begin boundary).'center'— read at the grid step's midpoint.'end'— read at the grid step's exclusive end (= the start of the next step).
The sample point determines which source events are "before" or
"after" the grid point — hold reads the most recent source ≤ the
sample point; linear interpolates across it.
range
cpu.align(
  Sequence.every('5s'),
  { method: 'hold', sample: 'begin' },
  { range: new TimeRange({ start: 0, end: 60_000 }) },
);
Pins the output range explicitly. Default is the source's own
extent. Use range when you want a uniform grid over a specific
window even if the source doesn't fill it — the output schema is
the same, just padded with undefineds outside the source range
(or the most recent value, depending on method).
Output schema
The output is an Interval-keyed TimeSeries<S> — same column
names and types as the source. Each row is one grid point.
aligned.schema[0].kind; // 'interval'
aligned.at(0)?.key(); // Interval — start = grid begin, end = grid end
aligned.at(0)?.get('cpu'); // number | undefined
The grid is half-open [begin, end) — events at exactly the
boundary belong to the later grid step.
Time-keyed output for chart libraries
align returns interval-keyed events (consistent with
aggregate). Most chart libraries want point-keyed output —
chain .asTime({ at }) to convert:
const points = cpu
  .align(Sequence.every('5m'), { method: 'hold', sample: 'end' })
  .asTime({ at: 'end' });
// points.at(0)?.key() is now a Time at the interval's end.
asTime's at option ('begin' | 'center' | 'end') picks where
on each interval the resulting Time lands.
Compared to aggregate
Same parameter shape (sequence + range), same output key shape
(Interval-keyed grid), different reduction.
| Question | Operator |
|---|---|
| "What was the value at this grid point?" | align(seq, { method, sample }) |
| "What's the rollup of every event in this bucket?" | aggregate(seq, mapping) |
// align — one row per minute, value sampled from the source.
cpu.align(Sequence.every('1m'), { method: 'hold' });

// aggregate — one row per minute, value reduced from sources inside.
cpu.aggregate(Sequence.every('1m'), { cpu: 'avg' });
For a chart at one-minute resolution where every grid point should
have a value, align is right. For "average CPU per minute,"
aggregate is right. The two are complementary.
See Aggregation for the bucketing operator.
See also
- Aggregation — bucket-rollup counterpart
- Sequences — grid definitions
- Cleaning data — handle gaps left by
holdorlinear(e.g. earlyundefineds before the first source) - Reducer reference — empty-bucket and
rolling-window behaviour for every reducer (relevant for the
aggregatecounterpart)